An Interactive Visualization of
Crosslinguistic Colexification Patterns

VisLR Workshop - Visualization as added value
in the development, use and evaluation of LRs
LREC 2014, Reykjavik

Thomas Mayer / thomas.mayer@uni-marburg.de
Johann-Mattis List / mattis.list@uni-marburg.de
Anselm Terhalle / terhalle@phil.uni-duesseldorf.de
Matthias Urban / m.urban@hum.leidenuniv.nl

Overview

Part I: Introduction

Polysemy, Homophony,
and Colexification

  • Polysemy: If a word has two or more meanings which are historically related.
  • Homophony: If two words which do not share a common etymological history have an identical pronunciation.
  • Colexification: If one word form denotes several meanings.

Polysemy, Homophony,
and Colexification

  • Polysemy: English wood 'forest; wood (material)'
  • Homophony: German Arm 'arm' vs. German arm 'poor'
  • Colexification: English wood, German Arm/arm, etc.

Cross-Linguistic Colexifications

Key Concept Russian German ...
1.1 world mir, svet Welt ...
1.21 earth, land zemlja Erde, Land ...
1.212 ground, soil počva Erde, Boden ...
1.420 tree derevo Baum ...
1.430 wood derevo Holz ...

CLICS

  • CLICS offers information on colexification in 221 different languages.
  • 301,498 words covering 1,280 different concepts
  • 45,667 cases of colexification, identified with help of a strictly automatic procedure, correspond to 16,239 different links between the 1,280 concepts in CLICS

Sources of CLICS

  • IDS (Key and Comrie 2007): 178 languages
  • WOLD (Haspelmath & Tadmor 2009): 33 languages
  • LOGOS (http://www.logosdictionary.org): 4 languages
  • Språkbanken (University of Gothenburg): 6 languages

Network Modeling of CLICS

Network modeling of CLICS is pretty simple:

  • Concepts are represented as nodes in our network.
  • Instances of colexification in the languages of CLICS are represented as links between the nodes (we link the concept 'poor' with the concept 'arm' since German colexifies both concepts).
  • Edge weights in the network reflect the number of attested instances of a given colexification or the number of languages or language families in which the colexification occured.

Network Modeling of CLICS

Complete network of CLICS

Communities of CLICS

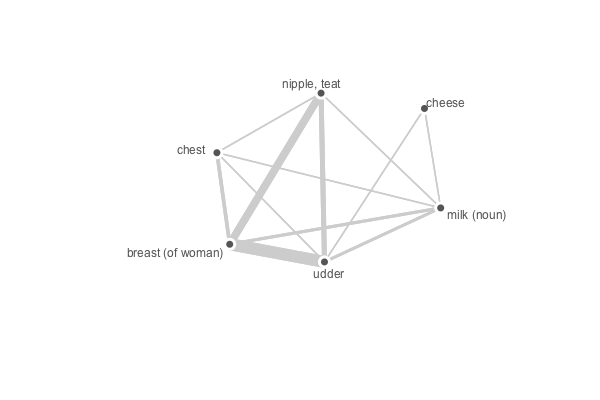
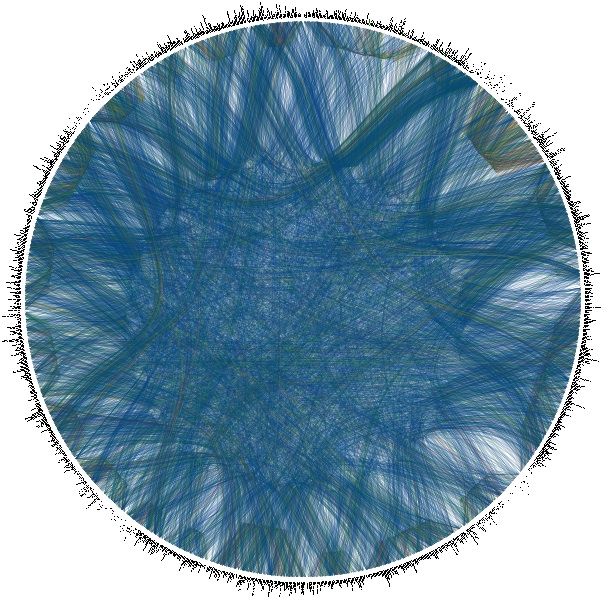
Since the resulting network is very, very dense, we try to break it down to smaller interesting pieces by:

  • using algorithms for community identification which break down the networks to small groups in which the number of links within the group is higher than the number of links outside the group (INFOMAP algorithm, Rosvall and Bergstrom, 2008), or
  • extracting subgraphs from the network with a certain resolution depth

Communities of CLICS

Part II: Visualization

Some advantages of
web-based visualizations

(cf. Murray 2010)
  • Platform independent
  • Accessible from any device with a browser supporting JavaScript
  • No need to install additional software on the part of the user
  • Links to external resources can be easily included

Interactive functionalities

  • Force-directed graph layout for communities
    • drag nodes to different positions where there is less overlap
    • panning and zooming
    • mouse over for more information on a certain node or edge
  • World map showing all languages featured in a given colexification pattern
  • Color coding for world regions

Implementation

  • The visualization is implemented in JavaScript using the D3 library (Bostock et al., 2011)
  • The force-directed graph is generated with the force() function from the d3.layout module.
  • The layout implementation uses position Verlet integration for simple constraints (Dwyer, 2009).
  • The dragging and panning functionalities of the graph are implemented with the drag() function from the d3.behavior module and the SVG transform and translate attributes.

Implementation (cont'd)

  • The interactive world map is generated with the topojson package and makes use of the d3.geo projection module.

Color coding

  • The color values for the world map gradient scale are computed from the two-dimensional geographical coordinates that are given as an input.

function cl2pix(c,l){
    var TAU = 6.2831853
    var L = l*0.61 + 0.09;
    var angle = TAU/6.0 - c*TAU;
    var r = l*0.311 + 0.125
    var a = Math.sin(angle)*r;
    var b = Math.cos(angle)*r;
    return [L,a,b];
};
                        
The code was adapted from the GNU C code by David Dalrymple ( http://davidad.net/colorviz/, accessed on January 25, 2014) and translated into JavaScript.

Color coding (cont'd)

    • The actual HTML color code is generated with the function d3.lab from the D3 library, which takes the three values for [L,a,b] as input.
    • The main reason for choosing the L*a*b* color space is a smoother transition between different color hues without any visible boundaries.
    • For the coloring of the language families, the background colors are generated with the categorical scale functions of the d3.scale module.

HSV vs L*a*b color space

Color scale

Part III: Case studies

Part III: Conclusions and future work

Conclusions

  • The size and complexity of today’s LRs call for a data preparation pipeline that enables researchers to find meaningful patterns among the multitude of different factors that can be taken into consideration.
  • Such a data preparation pipeline necessarily consists of two major parts:
    1. methods and techniques from data mining or computational linguistics help to detect basic trends or groups of similar objects in the search space.
    2. the resulting groups or trends are mapped to visual variables in order to make interesting observations readily accessible to human perception.

Future work

  • we plan to enhance the visualization tool with further interactive components that allow for a better overview of the complete network of colexifications and facilitate the detection of genealogical or areal trends in the database.
  • we intend to equip the user interface with further interactive components that allow users to explore the database from different perspectives (e.g., compare individual languages in terms of shared lexical associations).

The CLICS website

http://clics.lingpy.org
  • Featuring all functionalities presented in this talk
  • All communities and connections available as URLs
  • Networks can be exported as SVG
  • Featuring tabular representations for colexification patterns

Thank you for your attention!